| |
Logstash Notes |
Russell Bateman
November 2018
last update:
Logstash is the component, in the ELK stack, that collects logs, either by itself from sources on the local host, or from remote hosts cooperating in this by means of one or more Elastic Beats (Filebeats et al.) running on those other hosts targeting Logstash's hostname and port.
You can go from a Beat directly to ElasticSearch. Why would you want to go to Logstash (and thence to ElasticSearch)? If you expose Logstash outside the firewall behind which ElasticSearch lives or if you wish to enrich the content going into ElasticSearch. For example, if you want to massage a log entry before it goes to ElasticSearch and is displayed by Kibana.
Logstash is configured, as to what plug-ins and their settings, via...
# logstash -f logstash.yml
Logstash configuration consists principally of three sections which can be specified in any order:
This topic is very open-ended, but note the existence of a command-line option to launch Logstash, force it to read its configuration and report whether any of it was bad:
# logstash -f logstash.yml --config.test_and_exit
Other debugging will be covered in this document as relevant and timely.
Input can come from many places, but in particular, from stdin and from the more productive and expected origin of an Elastic Beat:
input
{
  stdin { }
  beats
  {
    port => "5044"
  }
}
See Appendix for an example of complete configuration for an instance of Filebeat plus Logstash.
The most typical output is Elasticsearch, configured as a list of hosts running this application. It's possible, however, to output to stdout and make that output useful to Ruby for debugging.
output
{
  elasticsearch { hosts => [ "localhost:9200", "remotehost:9200" ] }
  stdout { codec => rubydebug }
}
grok is the oldest filtering. It's based on regular expressions and is correspondingly expensive, slow and as well as suffers from difficulty in maintenance just as any solutions involving regular expressions.
I try not to use grok because of expense and because, for the things that I've done, dissect works better. There are "libraries" of grok (regular) expressions available, just Google for them.
If we were parsing /var/log/syslog, for instance, we might have the following:
filter
{
  grok
  {
    match =>
    {
      "message" => ...
    }
  }
}
This instructs Logstash to match (what's not expressed here except by "...") and assign the data it matches to new field (to be created) in the data named message. For the format of this regular expression, we could use:
"%{SYSLOGTIMESTAMP:syslog_timestamp} %{SYSLOGHOST:syslog_hostname} %{DATA:syslog_program}(?:\[%{POSINT:syslog_pid}\])?: %{GREEDYDATA:syslog_message}"
This also puts the entire syslog message line into field message.
Extracts structured fields from (more or less) unstructured event data, but without grok, which uses regular expressions. In Logstash processing, the slowest component will slow down the entire pipeline.
First, what data does the filter operate on?
The operation is mapping because you're mapping constituent parts of an existing field, let's say message in a syslog entry, to new fields (or tags). Here's the syntax:
filter
{
  dissect
  {
    mapping =>
    {
      "message" => ...
    }

    remove_field => [ "message" ]
  }
}
This means that this filter (in the Logstash pipeline of tasks to accomplish) will intercept each entry that contains a field, message, and treat it according to what's written. It won't touch any other field. When it has done this, it will also simply remove field message too. Now, you can rig any number of existing fields to be dissected into constituent fields if you want—even those you create new in your filter:
filter
{
  dissect
  {
    mapping =>
    {
      "message" => "%{field1} %{field2} %{description}"
      "description" => ...
    }

    remove_field => [ "message" ]
  }
}
After the above, message is discarded as unwanted, but description, which was create from message in the first place, persists even though it too is subjected to dissection.
But, we're writing this to discuss what kinds of operations we can run on message to produce other, new fields. Read on...
dissect is like a split operation, yet more succinct and powerful. Imagine in Java sort of being able to write:
void split( String string )
{
  String[] values;
  values  = string.split( "<", string );
  values += string.split( ">", string );
  values += string.split( " ", string );
  .
  .
  .
...except that these splits are to happen in just the right places. And as you go. And in a self-documenting way. Etc. You'll understand immediately when you read the examples here. Image a log entry that looks like this:
<9> Nov 14 08:09:23,169 127.0.0.1 WARN Core: An irregular situation has occurred.
dissect pattern-writing asks you to specify the patterns of delimiters between the fields of interest, queues up the delimiters and search the source text once from left to right, finding each successive delimiter in the queue. The format of the patterns of fields and delimiters is similar to grok as follows.
Yellow indicates delimiters; green indicates fields:
"<%{priority}> %{syslog_timestamp} %{+syslog_timestamp} %{+syslog_timestamp} %{severity} %{component}: %{message_text}"
What this means:
The delimiter exists physically in data you're parsing. For instance, above, it expects that there will be some value, priority, between opening- and closing angle brackets immediately followed upon by a syslog timestamp value (not complete) and additional space-separated syslog timestamp values all of which are to be concatenated together into a single syslog_timestamp field. Then, separated from the preceding by a space, is a value to call severity, then another space, and, finally, something called rest_url.
The delimiters on which the message is split are these (in order):
The new fields that will be created are:
...in addition to what might have been the original field (perhaps message).
Also, above, and used in the explanation, are field types:
t priority ... 9
9 14-Nov-2018 08:09:23,169...no priority field will be created, though it's named for self-documentary purposes, in the output from this pattern:
<?priority> %{timestamp} %{+timestamp}
Only the (entire) timestamp will be retained (in field timestamp).
<?priority> %{timestamp/2}-%{+timestamp/3}-%{+timestamp/1}
...which would produce (from the data we used already above):
timestamp: 2018-Nov-14Why are there spaces in the result here? This is because (as Elastic Logstash documentation says), the delimiter found before the field is appended with the value.
It's very useful to control the application of dissect using conditionals to reduce useless or confusing overhead. Below, unless the in-coming log entry is of type syslog, Logstash won't waste its time:
filter
{
  if [type] == "syslog" or "syslog" in [tags]
  {
    dissect
    {
      mapping =>
      {
        "message" => "%{ts} %{+ts} %{+ts} %{src} %{} %{prog}[%{pid}]: %{msg}"
      }
    }
  }
}
It's possible to rig the filter to convert some field from whatever they are (usually strings) to something else:
filter
{
  dissect
  {
    mapping =>
    {
      "message" => "%{time} %{+time} %{level} %{pid} %{thread} %{loggername} %{function} %{line} %{msg}"
    }
    convert_datatype =>
    {
      line   => "int"
      pid    => "int"
      thread => "int"
    }
  }
}
Here are some helps on Filebeat and Logstash configuration.
This is for the container Filebeat is running on. The certificates are offered by Sébastien Pujadas. Here are some useful links to sebp/elk, the best Docker container for ELK:
This demonstrates where to put them so that they enable Filebeat to communicate with Logstash. (This is your Filebeats-container Dockerfile):
FROM docker.elastic.co/beats/filebeat:6.4.2
COPY filebeat.yml /usr/share/filebeat/filebeat.yml
COPY logstash-beats.crt /etc/pki/tls/certs/logstash-beats.crt
COPY logstash-beats.key /etc/pki/tls/private/logstash-beats.key
USER root
RUN  chown root:filebeat /usr/share/filebeat/filebeat.yml \
                   /etc/pki/tls/certs/logstash-beats.crt \
                   /etc/pki/tls/private/logstash-beats.key
USER filebeat
Filebeat will deliver its host's messages, syslog and secure log files to Logstash on host elk-host.
filebeat.modules:
  - module: system

filebeat.inputs:
  - type: log
  enabled: true
  paths:
    - /var/log/messages
    - /var/log/secure
    - /var/log/syslog
  - type: docker
    containers.ids:    '*'
    containers.path:   '/var/lib/docker/containers'
    containers.stream: 'stdout'
    include_lines:     [ '^ERR', '^WARN' ]

output.logstash:
  hosts:           [ "elk-host:5044" ]
  ssl.enabled:     true
  ssl.certificate: "/etc/pki/tls/certs/logstash-beats.crt"
  ssl.key:         "/etc/pki/tls/private/logstash-beats.key"
This is for the ELK stack container. It creates a new container image from Sébastien Pujadas' ELK container and adds one filter to the Logstash pipeline configuration.
FROM sebp/elk:642
COPY 07-debug.conf /etc/logstash/conf.d/
COPY 08-cef.conf  /etc/logstash/conf.d/
This filter is an example of fixing up Common Event Format (CEF) log entries* to give more information to a Kibana user. It sort of completes these notes by showing a real-world implementation. It also should inform you that the tightness of your logging format can have a very big effect on what you can get Logstash to present to Elasticsearch (and thence to Kibana). The utility of your log files and Kibana to you, to your support staff or even to customers can be dramatically enhanced by paying attention what you put into your log statements (from your application code).
I added some very a-syntactic line-wrapping to make it fit (so, don't do that in your real file):
filter
{
  dissect
  {
    mapping =>
    {
      "message" => "%{acme.date} %{acme.time} CEF:%{acme.version}
                                      |%{acme.device_vendor}
                                      |%{acme.device_product}
                                      |%{acme.device_version}
                                      |%{acme.device_event_class_id}
                                      |%{acme.name}
                                      |%{acme.severity}
                                      |%{acme.extensions}"
    }
  }
  mutate
  {
    convert => { "acme.date" => "string" }
  }
}
If deploying using Docker Compose, here are the guts for the Filebeat and Logstash containers (well, the whole ELK container in Logstash' case).
version: '3.5'
services:
  .
  .
  .
  elk:
    image: acme-elk
    ports:
      - "5601:5601"
      - "9200:9200"
      - "9300:9300"
      - "5044:5044"
    ulimits:
      nofile:
        soft: 65536
        hard: 65536
    networks:
      acme:
    deploy:
      mode: global
      placement:
        constraints:
        - node.labels.acme.elk==true

  filebeat:
    image: acme-filebeat
    networks:
      acme:
    volumes:
      - "logs:/opt/logs"
    deploy:
      mode: global

networks:
  acme:
    name:     'acme'
    external: true
    driver:   bridge
* Here's an example of a CEF log entry I found at https://docs.incapsula.com/Content/read-more/example-logs.htm. Most of the content here is simply the extension, that is, a pile of key-value pairs. The bulk of the significant CEF is in bold and supports the rule pattern in the example above. (I've added backslashed for line-wrapping.)
CEF:0|Incapsula|SIEMintegration|1|1|Illegal Resource Access|3| \
fileid=3412341160002518171 sourceServiceName=site123.abcd.info siteid=1509732 \
suid=50005477 requestClientApplication=Mozilla/5.0 (Windows NT 6.1; WOW64; \
rv:40.0) Gecko/20100101 Firefox/40.0 deviceFacility=mia cs2=true \
cs2Label=Javascript Support cs3=true cs3Label=CO Support src=12.12.12.12 \
caIP=13.13.13.13 ccode=IL tag=www.elvis.com cn1=200 in=54 xff=44.44.44.44 \
cs1=NOT_SUPPORTED cs1Label=Cap Support cs4=c2e72124-0e8a-4dd8-b13b-3da246af3ab2 \
cs4Label=VID \
cs5=de3c633ac428e0678f3aac20cf7f239431e54cbb8a17e8302f53653923305e1835a9cd871db32aa4fc7b8a9463366cc4 \
cs5Label=clappsigdproc=Browser cs6=Firefox cs6Label=clapp ccode=IL cicode=Rehovot \
cs7=31.8969 cs7Label=latitude cs8=34.8186 cs8Label=longitude \
Customer=CEFcustomer123 ver=TLSv1.2 ECDHE-RSA-AES128-GCM-SHA256 \
start=1453290121336 request=site123.abcd.info/ requestmethod=GET \
qstr=p\=%2fetc%2fpasswd app=HTTP act=REQ_CHALLENGE_CAPTCHA \
deviceExternalID=33411452762204224 cpt=443 filetype=30037,1001, \
filepermission=2,1, cs9=Block Malicious User,High Risk Resources, cs9Label=Rule \
name
I have partly sorted out my problem writing filters. The problem has been that I can have only one dissect solution in place at a time. This was because I didn't know how to operate using conditionals (though I tried, but the format was unclear). Second, it appeared that the field, source in my case, wasn't perhaps available.
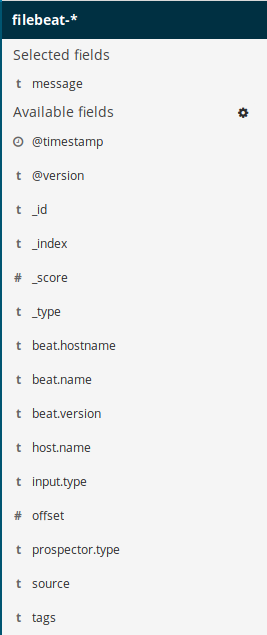
First, here's a list of exported fields that a filter can count on finding in what Filebeat sends it. In fact, this is not true. What is true is that, if you run your logfile data with no filter rules (that would remap what's in entries), you can look at what comes out (see illustration to right). Any fields in that list—and also in the list at the following URL, are available to your filter's code.
In particular, here it's the source field that interests me the most because (clicking on this fieldname in Kibana) I see I can expect the following contents for it:
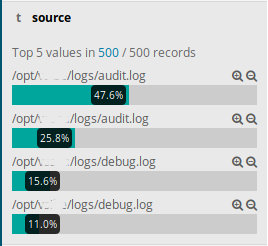
What we're seeing there (in Kibana) is that 47.6% of (the first 500) log entries are from /opt/acme-1/logs/audit.log. This particular log file is in CEF format and we have a dissect rule to parse it.
But, we also have (multiple) filter rules to apply to debug logs. So, we can't let processing go through just our CEF parsing. We keep that from happening by writing our filter like this:
filter
{
  if [source] =~ "debug"
  {
    # send debug.log entries through here:
    dissect
    {
      mapping =>
      {
        "message" => "[%{ignore}] %{acme.date} %{acme.time} - REST: Path: %{acme.restpath}"
      }
      # Now that the new, split-out fields are created, we don't need to keep
      # 'message' any longer:
      remove_field => [ "message" ]
    }
  }
  else
  {
    # send audit.log (purely CEF) entries through here:
    # CEF format:
    # 2018-11-28 15:11:09,635 CEF:Version|Device Vendor|Device Product|Device Version\
    #   |Device Event Class ID|Name|Severity|Extension
    # (line-wrapping below is illegal and won't work)
    dissect
    {
      mapping =>
      {
        "message" => "%{acme.date} %{acme.time} CEF:%{acme.version}|%{acme.device_vendor}\
                  |%{acme.device_product}|%{acme.device_version}|%{acme.device_event_class_id}\
                  |%{acme.name}|%{acme.severity}|%{acme.extensions}"
      }
      # Now that the new, split-out fields are created, we don't need to keep
      # 'message' any longer:
      remove_field => [ "message" ]
    }

    # Parse 'acme.extensions' for its key-value pairs and put the keys out as
    # separate fields (with values). Values parsed out are impoverished beyond
    # the first space they contain without 'field_split_pattern' and
    # 'whitespace' below. The results are prefixed for easy recognition.
    kv
    {
      source              => "acme.extensions"
      field_split_pattern => " (?=[A-Za-z0-9]+=)"
      whitespace          => "strict"
      prefix              => "acme_kv."
    }
  }
}
(Nota bene: experimentation with the code above appears to demonstrate that the conditional, if [source] =~ "debug", cannot be written if [ source ] =~ "debug", for this was seen to fail.)
How this is done is explained here: Logstash Configuration Examples: Using Conditionals. What's completely unclear in the documentation, however, is what the expression, if [path] =~ "access" does. What language is this? What is this operator, =~? Elastic refuses to tell us anywhere I've seen in their documentation.
My personal belief is that this is Ruby.
In Ruby core documentation for Strings, we learn that, for string =~ object, if object is a regular expression, it's used as a pattern to match against string. The result is the position at which the match begins or nil, i.e.: the expression evaluates to nil or non nil, which the Logstash filter plug-in treats as false (0 or null) or true (non 0 or nonnull).
In this way, above, if "debug" matches anything in source, whose value could be any of the paths listed above, then processing will engage the mapping pattern that locates "REST: Path: ______" in messages.
I split the filter code above out into two, separate pipeline configuration files. It makes it simpler to maintain, still works and probably presents a number of other advantages.
filter
{
  if [source] =~ "debug"
  {
    # send debug.log entries through here:
    dissect
    {
      mapping =>
      {
        "message" => "[%{ignore}] %{acme.date} %{acme.time} - REST: Path: %{acme.restpath}"
      }
      # Now that the new, split-out fields are created, we don't need to keep
      # 'message' any longer:
      remove_field => [ "message" ]
    }
  }
}
filter
{
  if [source] =~ "audit"
  {
    # send audit.log (purely CEF) entries through here:
    # CEF format:
    # 2018-11-28 15:11:09,635 CEF:Version|Device Vendor|Device Product|Device Version\
    #   |Device Event Class ID|Name|Severity|Extension
    # (line-wrapping below is illegal and won't work)
    dissect
    {
      mapping =>
      {
        "message" => "%{acme.date} %{acme.time} CEF:%{acme.version}|%{acme.device_vendor}\
                  |%{acme.device_product}|%{acme.device_version}|%{acme.device_event_class_id}\
                  |%{acme.name}|%{acme.severity}|%{acme.extensions}"
      }
      # Now that the new, split-out fields are created, we don't need to keep
      # 'message' any longer:
      remove_field => [ "message" ]
    }

    # Parse 'acme.extensions' for its key-value pairs and put the keys out as
    # separate fields (with values). Values parsed out are impoverished beyond
    # the first space they contain without 'field_split_pattern' and
    # 'whitespace' below. The results are prefixed for easy recognition.
    kv
    {
      source              => "acme.extensions"
      field_split_pattern => " (?=[A-Za-z0-9]+=)"
      whitespace          => "strict"
      prefix              => "acme_kv."
    }
  }
}
When I start my containers (in particular, my ELK and Filebeat containers), I like to get ELK's id, then get into it:
$ docker stack deploy -c docker-compose.yaml acme
$ docker ps --format '{{.ID}}\t{{.Image}}\t{{.Status}}' -a
(Let's say the ELK container's id is 6597c035a965)
$ docker exec --user root -it  6597c035a965  bash
Then, I checkout these files in /var/log/logstash:
root@6597c035a965:/# cd /var/log/logstash
root@6597c035a965:/var/log/logstash# ll
total 19036
drwxr-xr-x 1 logstash logstash     4096 Dec 15 20:29 ./
drwxr-xr-x 1 root     root         4096 Oct  5 19:12 ../
-rw-r--r-- 1 logstash logstash 18899721 Dec 15 20:29 debug.log
-rw-r--r-- 1 root     root            0 Dec 15 20:28 logstash.err
-rw-r--r-- 1 logstash logstash   286689 Dec 15 20:29 logstash-plain.log
-rw-r--r-- 1 logstash logstash        0 Dec 15 20:28 logstash-slowlog-plain.log
-rw-r--r-- 1 root     root       286778 Dec 15 20:29 logstash.stdout
If I tail logstash-plain.log (immediately or edit it and look near the top), I can see if there's an error that's broken my filter (not shown here).
root@6597c035a965:/var/log/logstash# tail -f logstash-plain.log
[2018-12-15T20:28:48,285][INFO ][logstash.setting.writabledirectory] Creating directory {:setting=>"path.queue",...
[2018-12-15T20:28:48,293][INFO ][logstash.setting.writabledirectory] Creating directory {:setting=>"path.dead_le...
[2018-12-15T20:28:48,669][WARN ][logstash.config.source.multilocal] Ignoring the 'pipelines.yml' file because modul...
[2018-12-15T20:28:48,702][INFO ][logstash.agent           ] No persistent UUID file found. Generating new UUID {:uu...
[2018-12-15T20:28:49,377][INFO ][logstash.runner          ] Starting Logstash {"logstash.version"=>"6.4.2"}
.
.
.
When lines begin streaming into this file, you can be sure that something is working. Turn to your browser to check out Kibana.
Create a pipeline-configuration file thus. This will drop a file, debug.log, on the path, /var/log/lostash that will contain output in the Ruby-debug format.
output
{
  file
  {
    path  => "/var/log/logstash/debug.log"
    codec => "rubydebug"
  }
}
The output debug file will contain stuff like this. Caution: it will get very big—on the order of one or more of these structures per log entry processed. Note that field tags contains "_dissectfailure".
{
        "source" => "/opt/acme-2/logs/debug.log",
      "@version" => "1",
         "input" => {
        "type" => "log"
    },
        "offset" => 2762812,
          "host" => {
        "name" => "93dfeb0f3845"
     },
    "prospector" => {
        "type" => "log"
     },
          "beat" => {
            "name" => "93dfeb0f3845",
         "version" => "6.4.2",
        "hostname" => "93dfeb0f3845"
     },
    "@timestamp" => 2018-12-07T17:45:56.620Z,
          "tags" => [
        [0] "beats_input_codec_plain_applied",
        [1] "_dissectfailure"
     ],
       "message" => "[http-bio-8181-exec-105] 2018-11-28 17:14:03,970 - REST: Request length: 72"
}
When you look at message, it's clear that our "debug.log" filter above will fail, hence the existence of "_dissectfailure" in tags. As there is no coverage for this, it doesn't concern me except to point out the need to handle such failure for those log entries I anticipate handling (and this is one of them).
Yeah, we'll get this right pretty soon.
Got a couple of replies to Use of keyword 'else' causes error "Couldn't find any filter plugin named 'else'". What have I learned from the answers? That I've made some stupid assumptions about filter-writing. I'm still not going to be clear of those assumptions, but just reading that "the last remove_field cannot stand on its own, but should be part of a filter, e.g.: a mutate filter" brings such dawn to my spirit. First, I thought I was writing a filter. I mean, the first thing in the code is the keyword, filter. So, there are multiple definitions of filter?
This probably explains why I've not been able to remap the acme.date field, one of the first unresolved problems I had and gave up on, Timestamp problem created using dissect:
mutate
{
  convert => { "%{acme.date}" => "string" }
}
...is only an answer if you understand that there are filters, which I'm writing and filter constructs, which are what these answer-posters are sometimes calling filtera. You may think that everything below in the grey background is a filter, but it's not—only the bits in bold black.
filter
{
  dissect
  {
    mapping =>
    {
      "message => "%{month} %{day} %{time} %{hostname} CEF:%{v}|%{vendor}|%{product}|%{version}|%{id}|%{name}|..."
    }
  }

  if "_dissectfailure" not in [tags]
  {
    remove_field => [ "message "]
  }
}
Which is why, to get the "filter" above to drop message from its complement of fields, you must code as below: you have to get the statement to remove message into the mutate plug-in's order or it is a syntax error flagged in /var/log/logstash/logstash-plain.log. However, you just have to get stuff done inside a plug-in (usual caveat about line-wrapping in this code):
filter
{
  if [source] =~ "debug"
  {
    dissect
    {
      mapping =>
      {
        "message" => "[%{ignore}] %{acme.date} %{acme.time} - REST: Path: %{acme.restpath}"
      }
      remove_field => [ "message" ]
    }

    if "_dissectfailure" in [tags]
    {
      dissect
      {
        mapping =>
        {
          "message" => "[%{ignore}] %{acme.date} %{acme.time} - REST: Request length: %{acme.requestlength}"
        }
        remove_field => [ "message" ]
        remove_tag   => [ "_dissectfailure" ]
      }
    }

    if "_dissectfailure" in [tags]
    {
      dissect
      {
        mapping =>
        {
          "message" => "[%{ignore}] %{acme.date} %{acme.time} - REST: MediaType: %{acme.mediatype}"
        }
        remove_field => [ "message" ]
        remove_tag   => [ "_dissectfailure" ]
      }
    }

    if "_dissectfailure" in [tags]
    {
      dissect
      {
        mapping =>
        {
          "message" => "[%{ignore}] %{acme.date} %{acme.time} - REST: Calling Protect - %{acme.callingprotect}"
        }
        remove_field => [ "message" ]
        remove_tag   => [ "_dissectfailure" ]
      }
    }

    if "_dissectfailure" in [tags]
    {
      dissect
      {
        mapping =>
        {
          "message" => "[%{ignore}] %{acme.date} %{acme.time} - Request - [HTTP METHOD:%{acme.method}] \
                             [PATH INFO:%{acme.pathinfo}] [REMOTE ADDRESS:%{acme.remoteaddress}] \
                             [CONTENT LENGTH:%{acme.contentlength}]"
        }
        remove_field => [ "message" ]
        remove_tag   => [ "_dissectfailure" ]
      }
    }
  }
}
# vim: set tabstop=2 shiftwidth=2 expandtab formatoptions-=t:
Let's dissect (no pun intended) the code above.
First, we don't want to burden processing time looking for these patterns in the case of messages we know to be from audit.log files or other logs than from debug.log files.
We try one pattern (REST: Path:), but if it fails, we observe that and try another (REST: Request length:). If ever we succeed, we eliminate field message because it's served its purpose. These dissect paragraphs are, in the parlance of most answer posters, filters proper. Our calls to remove_field and remove_tag must be made in filter context. Look here:
filter
{
  # We avoid wasting time in this filter unless from a debug.log file!  The =~ operator invokes
  # a regular expression equals (i.e.: right-hand side finds a match in left-hand side).
  if [source] =~ "debug"
  {
    dissect
    {
      mapping =>
      {
        "message" => "[%{ignore}] %{acme.date} %{acme.time} - REST: Path: %{acme.restpath}"
      }
      # We can do remove_field here because inside dissect.
      # Also, statements here get executed only if dissect succeeds.
      remove_field => [ "message" ]
    }

    if "_dissectfailure" in [tags]
    {
      dissect
      {
        mapping =>
        {
          "message" => "[%{ignore}] %{acme.date} %{acme.time} - REST: Request length: %{acme.requestlength}"
        }
        # Just as before, we want to remove message because we're done. We remove the
        # _dissectfailure from tags that got us here in the first place because we don't
        # want it set in the final output.

        remove_field => [ "message" ]
        remove_tag   => [ "_dissectfailure" ]
      }
    }

    .
    .
    .
  }
}
This actually works; I've verified it.
Example; with caveats about line-wrapping...
filter
{
  if "audit.log" in [source]
  {
    dissect
    {
      mapping =>
      {
        "message" => "%{acme.date} %{acme.time} CEF:%{acme.version}|%{acme.device_vendor}|\
                   %{acme.device_product}|%{acme.device_version}|\
                   %{acme.device_event_class_id}|%{acme.name}|\
                   %{acme.severity}|%{acme.extensions}"
      }
      remove_field => [ "message" ]
    }

    # This seems to accomplish nothing: doesn't change 'acme.date' at all.
    mutate { convert => { "%{acme.date}" => "string" } }

    # Parse 'acme.extensions' for its key-value pairs and put the keys out as
    # separate fields (with values). Values parsed out are impoverished beyond
    # the first space they contain without 'field_split_pattern' and
    # 'whitespace' below. The results are prefixed for easy recognition.
    kv
    {
      source              => "acme.extensions"
      field_split_pattern => " (?=[A-Za-z0-9]+=)"
      whitespace          => "strict"
      prefix              => "acme_kv."
      remove_field        => [ "acme.extensions" ]
    }
  }
}