JConsole notes
Russell Bateman
March 2017
last update:
|
|
JConsole notes
|
JConsole is a GUI-base monitoring tool for Java applications (or anything running on a Java Virtual Machine). It works to monitor an application on local or remote hosts. It's relatively lightweight though its use of MBeans can pile on some 20 Mb per minute of monitoring—much of which will be garbage-collected on an on-going basis.
You must launch the application with a number of JVM options. Below, the options in blue cause garbage-collection timestamps to be written to whatever log is available for the application. This is often relevant to profiling when using JConsole. The rest, in black, are required whether you're profiling an application running on a remote host or not:
-XX:+PrintGCDetails
-XX:+PrintGCDateStamps

-Dcom.sun.management.jmxremote=true
-Dcom.sun.management.jmxremote.port=9098
-Dcom.sun.management.jmxremote.rmi.port=9098
-Dcom.sun.management.jmxremote.authenticate=false
-Dcom.sun.management.jmxremote.ssl=false
-Dcom.sun.management.jmxremote.local.only=false
-Djava.rmi.server.hostname=127.0.0.1
-Djava.net.preferIPv4Stack=true
Port 9098 is arbitrary: you can choose any port that's free. This port must be open through the firewall if the host on which the application is running is remote. Use iptables punch a hole through the firewall:
# iptables -A INPUT -p tcp --dport 9098 -j ACCEPT
...and use:
# iptables -D INPUT -p tcp --dport 9098 -j ACCEPT
...to plug the hole once you've finished monitoring.
Address/hostname 127.0.0.1, meaning localhost, must be replaced by the host's IP address or DNS name if running remote.
First, ensure that the application you're monitoring is running. Next, from the command line (this backgrounds JConsole and makes it so I can kill the console I started it from without causing JConsole to shut down too):
$ jconsole &
$ disown
Next, click Remote Process, if appropriate, and type in the remote host name or address and port in the format shown, something like:
10.10.10.92:9099
Rarely must Username: and Password: be furnished. (I don't cover when/how that is necessary.)
If running locally, however, click Local Process and find your process in the list of running JVM processes. Use
grep -ef | gre [a]pplication-name
...to help if you need. For example, here I'm going to see what's going on with my Apache NiFi service.
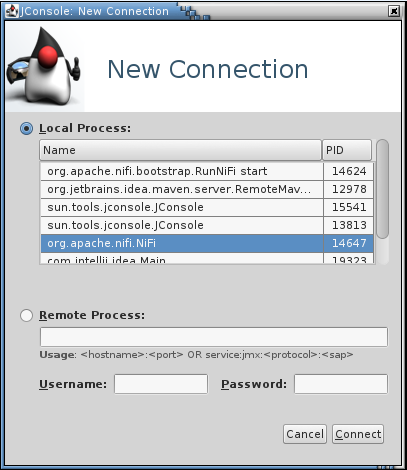
Next, click Connect. Immediately, you may see this dialog:
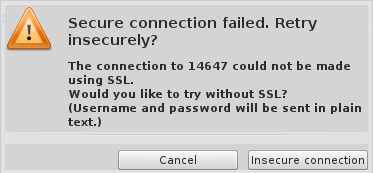
...which you should answer appropriately for your case, usually by clicking Insecure connection).
Here are those steps again:
Once JConsole is loaded and a connection established with the application, you should begin to see something like this (as I write this, mine had run for a few minutes before I took this screenshot):
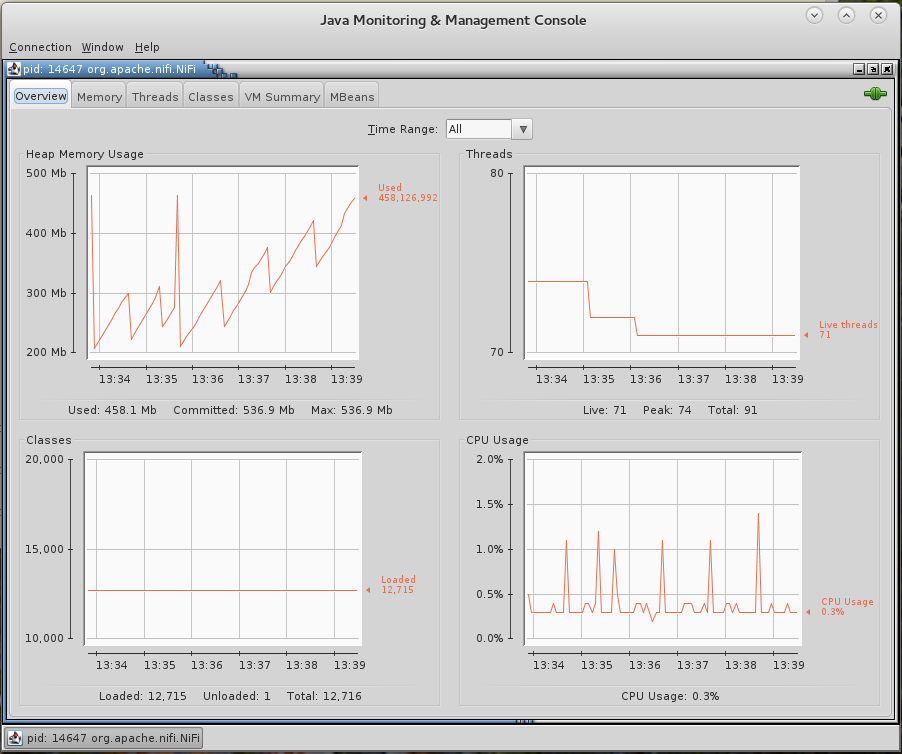
From left to right, there are tabs:
This tab, seen above, already has a quick summary of what's going on in Memory, Threads, Classes and CPU Usage.
...shows percentage from 0% to 100%. If your host has _________ Xeon processors, each with ___ cores, then... . If you go do something in your application, that will cause this CPU usage graph to deflect (upward, presumably).
This is the place you'll spend most of your time. Let's look at what's available. I've labeled a few spots in orange.
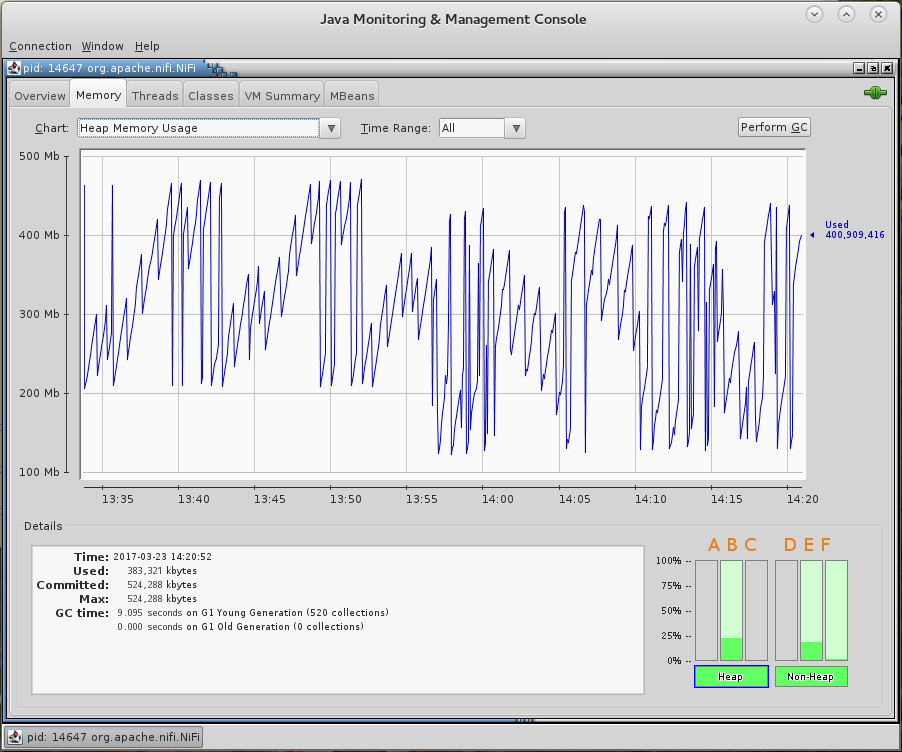
This graph is memory (heap) used by the running JVM and your application (and not any other application including, as is the case for Apache NiFi, the boostrap piece).
The up and down vascillation in this illustration is memory being allocated (though object instantiation, an upward deflection) and, once no longer used, garbage collected (the downward deflection).
In the lower, right-hand corner are two groups of three columns that I've labeled A B C and D E F.
To apply this to NiFi, if we put too many flowfiles into memory (instead of swapped out) and this fills up (darkgreen all the way to the top of the column), we either have to back off or get more memory (set java.arg.3=-Xmx to a higher number in /opt/nifi/conf/bootstrap.conf).
In such an application, that's running out of memory, the less informed among us might conclude that we just need to get (buy and configure) more memory, but it's smarter to ask, "Why is the application running out of memory?"
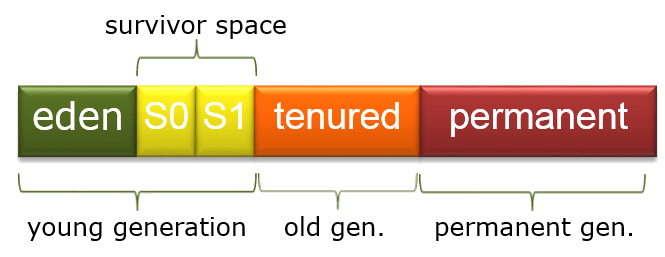
Here's an illustration of Java garbage collection to refer to.
Last, the Details pane. This a summary along with high-level information about the garbage collector. "Marksweep" is garbage collection that will stop literally everything (all the threads) in the JVM at some point to figure out what's what and fix it. This can be debilitating if your application is grossly out of memory.
"Scavenge" is the sort of garbage collection that is lighter, looking for low-hanging fruit, that is, memory that's obviously no longer used and is easily collected.
As shown, this display charts the JVM's threads, connector threads, our threads, etc. You might recognize some of your application's threads from the list of names in the lower, left-hand pane.
Clicking on a thread, you can get an instantaneous stack trace in the lower, right-hand pane for the thread.
You can turn on Detect Deadlock, which will detect when a thread is permanently parked and will never wake up, for example, the ABBA embrace of death (thread A holding a lock that thread B needs to continue while itself holding a lock thread A needs).
The count of classes loaded shows also the "high watermark" or total number of classes loaded which will exceed the number of classes currently loaded.
This displays loads of fairly (but not completely) static information including what options the JVM was invoked with (including our at the beginning of this article), class paths, library paths, etc.
In addition, you can find out what OS is running, the CPU architecture, number of processors (cores).
The JVM incorporates MBean (managed bean) instances that JConsole uses to obtain all this information. These are objects of Java Management Extensions (JMX). If you're familiar with some of these, you can actually modify what JConsole is reporting, but this is dark magic.
I had used Java Mission Control and the Java Flight Recorder from Oracle. These are very fancy tools that, beyond JConsole, also tackle disk and socket I/O. However, JConsole will work from OpenJDK and the JVM options needed do not appear to be order-dependent while you must use the Sun (Oracl) JDK to use JMC and there is order-dependence when you set up an application to make use of it.
JConsole is more accessible than JMC. Moreover, extended and especially commercial use of JMC is not free. You must deal with Oracle licensing to use it outside of minimal, developer scenarios. (I am not making an expert, legal statement here and you may not impute any legal implication to my having said this.)
Connect JConsole to the application and run it a while. Start analyzing the Memory tab. Watch the graph climb to confirm memory-leak suspicions. Use jvisualVM to take a head dump in the Monitor tab. Use Eclipse's memory analyzer (MAT) to take the heap dump file and find leaks. It will give some false positives such as java.lang.Class that you should ignore.